Navigating the world of Foreign Exchange (FOREX) trading can be confusing for traders from any level of trading. Whether they have experience in trading stocks, commodities or bonds, the average trader may not understand this fairly new market that is available. Due to this confusion, many may claim that forex trading is a scam. However, we will show you that trading forex is easy.
Here are 10 tips and tricks to get you started in making trading forex profitable and why you should have an investment in forex.
UNDERSTAND WHAT YOU’RE TRADING
The Foreign Exchange (Forex or FX) market has been about ever since the time of the Babylonians. However, it wasn’t until recently in the 1970s that investors have found it as a security that could be traded for large gains. So how does forex trading work? Well, just like any trading instrument, you either buy or sell; the market is based on supply and demand. Let’s have a closer look at this:
EUR / USD
Base Currency / Quote Currency
Above, you will find a currency pair. Every forex related instrument is a currency pair. On the left, you will have a Base Currency. On the right, you will have the Quote Currency. So, what does this mean? It means that when you are looking at a chart you will be looking at prices denoted in the quote currency in relation to the base currency. For example:
EURUSD Current Price – 1.18532
The price denoted above (1.18532) means that 1 Euro is equivalent to 1.18532 USD.
So how do you trade this? How does trading work? For many beginners walking into the forex market, they will not be able to understand the concept of buying or selling the currency pair aside from buying meaning “the price will go up” and selling meaning “the price will go down”. Here’s the reality, even experienced traders will not be able to understand this concept and therefore think that trading forex is merely gambling on a 50/50 chance that the price will go up or down. You may also wonder where is it that your profit is coming from.
So, what is it that you are buying or selling? Unlike stocks, where when you buy a stock you “physically” hold shares in a company, with forex trading you are essentially trading CFDs. CFD stands for Contract for Difference. What this means is that you are not trading any physical goods or securities. Therefore, this will explain how it is you are able to open up a “sell” position, for a foreign currency you do not physically hold.
Think of it this way, whether you open up a long (buy) or short (sell) position you will always, in reality, be buying. For instances, on EURUSD, if you open a long position you are buying the base currency (EURO) in hopes that the value of the EURO compared to the US Dollar goes up. The inverse is also the same; as you open a short position, you are buying USD, in hopes that the value of the EURO falls in relation to the US Dollar OR that the US Dollar value will rise in relation to the EURO.
This may sound confusing but have a look at these charts below:
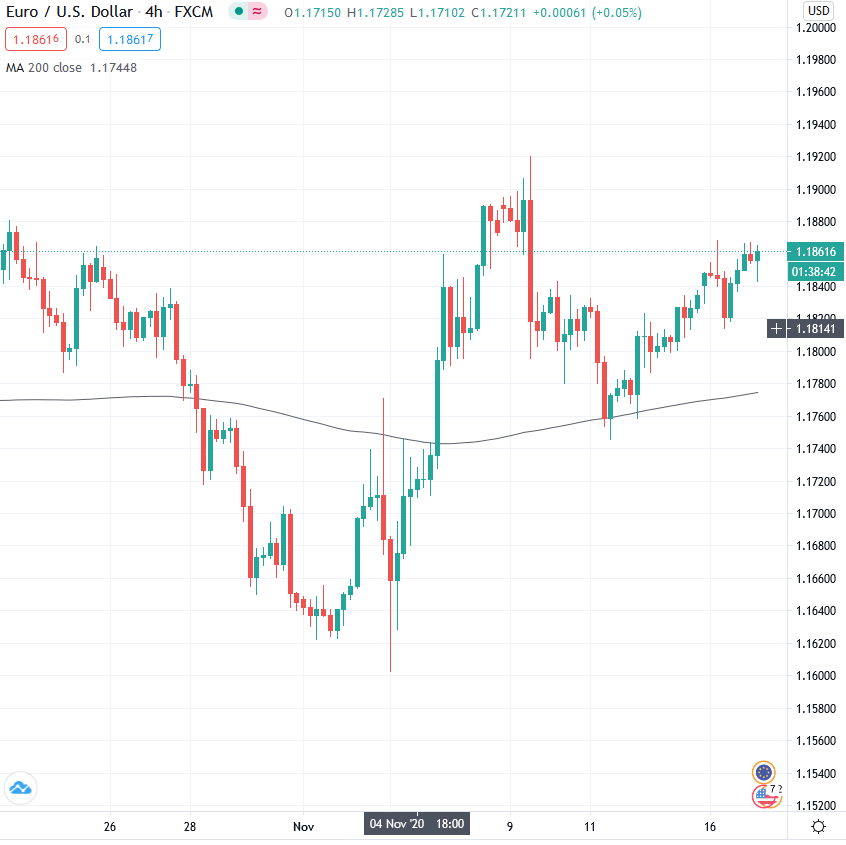
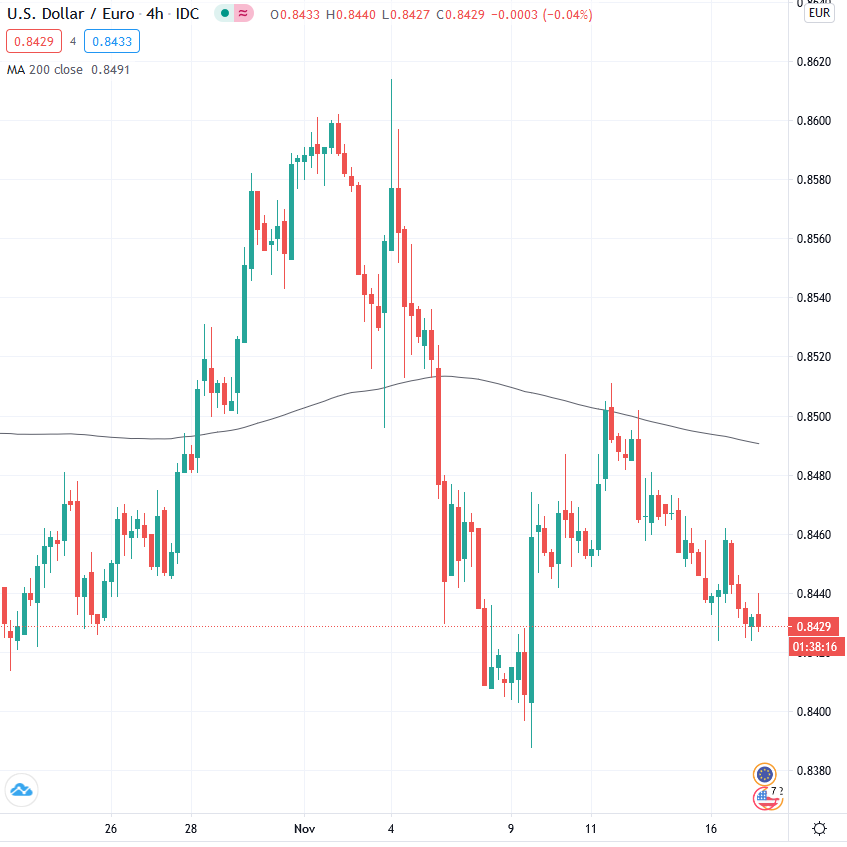
Figure 1: EURUSD Chart
Figure 2: USDEUR Chart
Figure 1 shows the EURUSD chart. Figure 2 shows the USDEUR chart. As you can see, the charts are inversely related. This means that when the EURO goes up in value, the USDEUR chart indicates a downward movement whereas the EURUSD chart indicates an upward movement.
Congratulations! Now that you know what you are trading, let’s move on to getting started.
DOWNLOAD METATRADER 4
Metatrader 4 (MT4) is a platform most forex traders are familiar with. As the world’s most stable platform with over a hundred tools and indicators, the platform is used by a majority of brokers. That is why you will most likely have come across the name “Metatrader 4” over the course of your forex trading career.
The reason why you should download MT4 even if you aren’t trading with a broker yet is to familiarize yourself with the platform. When initially logging into MT4 you will get started on a demo account. Here you will be able to see price charts for different CFDs. In the demo account, you may test any trading strategies you come across.
Get started by downloading Metatrader 4 (MT4) using this link https://www.metatrader4.com/en/download
Metatrader 4 (MT4) is available for Web, PC, Android and iOS. However, when you have decided on your broker please check on which platform they support as they may be limited to certain devices.
LEARN TO READ THE CHART
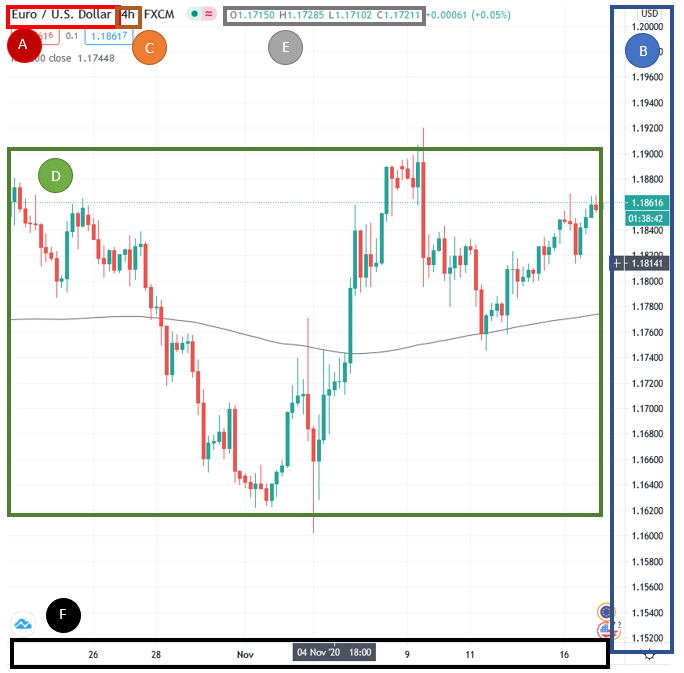
So, you finally got yourself a demo account on MT4. Now you are stuck looking at a chart that goes up and down but you have no idea what’s going on. Let’s have a quick look at this. Here we have an example figure from TradingView. Don’t worry charts are pretty much the same wherever you go.
| Item | Description | Remarks |
| A | Currency Pair | EURUSD – Where Euro is the base currency and USD is the Quote Currency. |
| B | Price | The price is denoted in USD. |
| C | Time Frame | The time frame is 4 Hours. |
| D | Candlestick Chart | 4 Hour Candlesticks |
| E | OHLC | O – Open. H – High. L – Low. C – Close. |
| F | Date and Time | Date and Time of each candlestick open and close. |
As seen above, these are the main parts of chart. Item A indicates the currency pair or instrument that is being viewed. Item B shows the price of the chart that is denoted in the quote currency. Item C is the timeframe. The timeframe can be anything ranging from 1 minute to 1 month. In the chart, it indicates 4H, which means that each candlestick is based on a 4-hour time frame. What does this mean? Well, simply put it means that the duration from a candle stick opening to closing it takes 4 hours. So, in one day there are 6 of these candlesticks. Item D is the candlestick chart. Item E is OHLC, which indicates the Opening price, the Highest price the price has gone up to during the duration, the Lowest the price has gone during the period, and the Closing price. Item F will show when the candlestick has opened up.
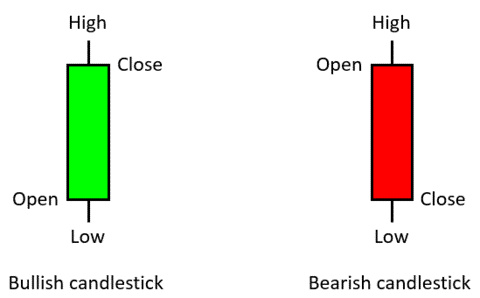
There may be an instance where instead of seeing a candle stick chart, you may be facing a line chart. In a line chart, the price indicated regardless of timeframe will show closing prices. A bar chart is similar to a candlestick chart where it shows the opening and closing prices. The most common chart you will be looking at in most trading scenarios is the candlestick chart as a candlestick contains the most amount of information. In order to understand what goes into a single candlestick, please have a look at the figure below:
MANAGING YOUR RISK WITH FOREX LOT SIZES
Now that you know how to read a chart, you will need to know how to trade but more specifically, how much it is you are trading. When trading with leverages and margin, you will be limited to the volume you are trading. The reason why you are doing leverage trading is to ensure profitability.
Think of it this way if you were to only have 1 Euro that is valued at 1.18532, if the price goes up by one point to a price of 1.18533 you won’t really be making any money that you would be able to see. Therefore, trading forex will require trading in large volumes. When trading on Metatrader 4 the lot size will be denoted differently with the lowest being 0.01. Below is a table on how to identify how much volume you are trading:
| Name | Units | MT4 |
| Micro Lot | 1,000 | 0.01 |
| Mini Lot | 10,000 | 0.10 |
| Standard Lot | 100,000 | 1.00 |
Let’s say for example, you are a conservative trader and open a long position on MT4 with 0.01 on EURUSD at a price of 1.18532. That means you have bought 1,000 units of EURO. The price goes up by 10 points (1 pip) to 1.18542. You would see profit of 10 cents. If it goes up by 100 points (10 pips) to 1.18632, you would see a profit of $1. If you had a position of 0.10, that would translate to $10 profit and if you had a position of 1.00 that would be $100 profit.
Trading large volumes is attractive for higher risk. However, it is also riskier as you will be able to lose as much as you would win. Deciding on your trade volume size will determine how much risk you are able to stomach during a trade. Please note that your trade volume will be determined by the margin requirements of the currency pair you are trading. Margin requirements vary differently between the currency pairs. EURUSD has the lowest margin requirement.
How much margin you have and how much the margin requirement is for entering a position on a certain currency pair will be determined by the amount of leverage you have from your broker. A higher leverage means that you will have a larger margin and lower margin requirements. This allows you to open up larger volume trades; whereas a lower leverage will give you a smaller margin and higher margin requirements.
FIND THE TREND
The easiest way to trade is to go with the flow. About 30% of the time a market is in trend. On the other hand, in 70% of the time, markets are in consolidation. This means that if you follow the trend and only the trend itself, you are already placing yourself in a higher chance to win on the financial markets. So how do you find a trend? Refer to our diagram below:
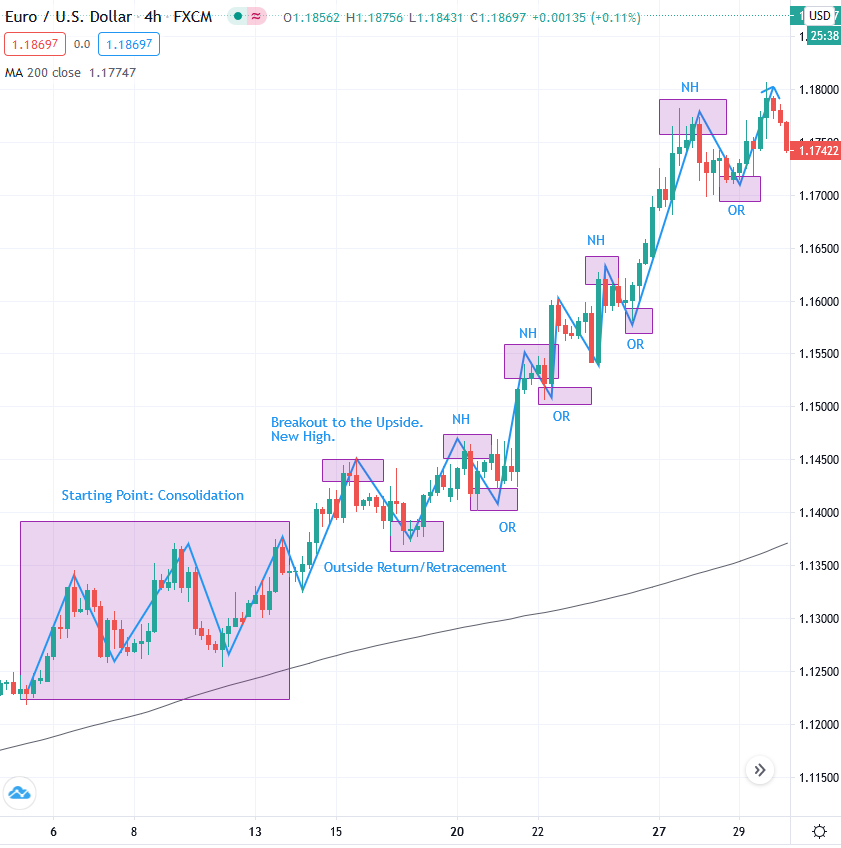
In an uptrend, you will find that the chart continues to make new highs (NH). When it retraces or makes and outside return (OR), the low will not go lower than the previous low. In a downtrend, you will find the exact opposite case, you will find the market making lower lows, and the highs will not go higher than the previous high.
| Up Trend (Bullish) | Down Trend (Bearish |
| New Highs (Higher Highs) Higher Lows | New Lows (Lower Lows) Lower Highs |
In a trending market, you will be able to minimize your risk by setting your trades to go with the flow. While this is the least risky way to trade, please bear in mind that markets are prone to reversals. That is why there is an important to set stop losses and take profits to identify where you will exit the market.
GET FAMILIAR WITH SUPPORT AND RESISTANCE
A lot of what happens in the forex market depends on supply and demand. It depends on what everyone is looking at. These areas or key levels are indicated by support and resistance. The price action of a currency pair depends on the supply and demand at certain levels. The reason this happens is because other traders, including financial personnel, hedge fund managers, brokers and banks are looking at the same exact thing you are looking at. So, people are looking to exit the market at certain areas. These areas are based on market history. Let’s have a look at this:
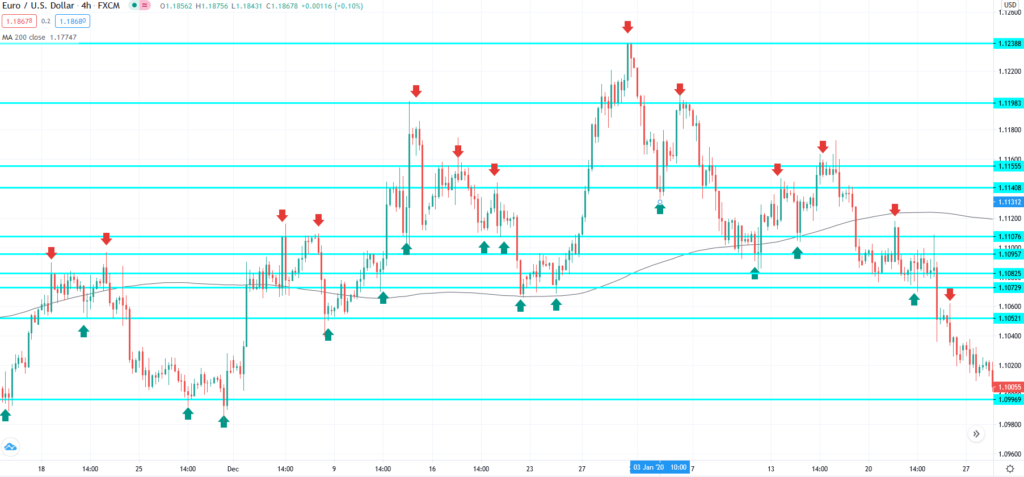
Supports and resistances are identified by areas where prices rebound from. Looking at the chart above, you will find different horizontal lines which indicate supports and resistances and where the market has rebounded from. As time progresses, these areas continue to be the same place where prices rebound from, as you can see from the amount of times each support and resistance has been touched.
The reason why price rebounds at certain levels is because they are target areas. For example, if have a bullish trend, and there’s a resistance. This area is where traders will most likely take their profits. When that happens, there are less buy positions in the market in comparison to sell positions, driving the price down (causing the outside return as shown in the previous example).
In a bearish trend, a price will be headed towards a support as the target for take profits. Once the price has reached the target and traders close their profitable positions, there will be more buy positions on the market, driving the price up.
Understanding support and resistance is key in trading forex from a technical standpoint. Understanding why these areas are significant when it comes to trader supply and demand will give you and advantage on where you may want to enter and exit the market. Advanced traders may also supplement this with Fibonacci rules as that also indicates supports and resistances that other traders are looking at.
CANDLESTICK PATTERNS
History repeats itself. Therefore, the market always shows a pattern. There are certain patterns that can also be seen by candlestick formations. For instances, when a candle opens up and posts a high first, the chances are that it will be a bearish candle because it will post a high then post a low before closing. In another case a candlestick may open up posting a low first and will most likely turn into a bullish candle by posting a high before closing.
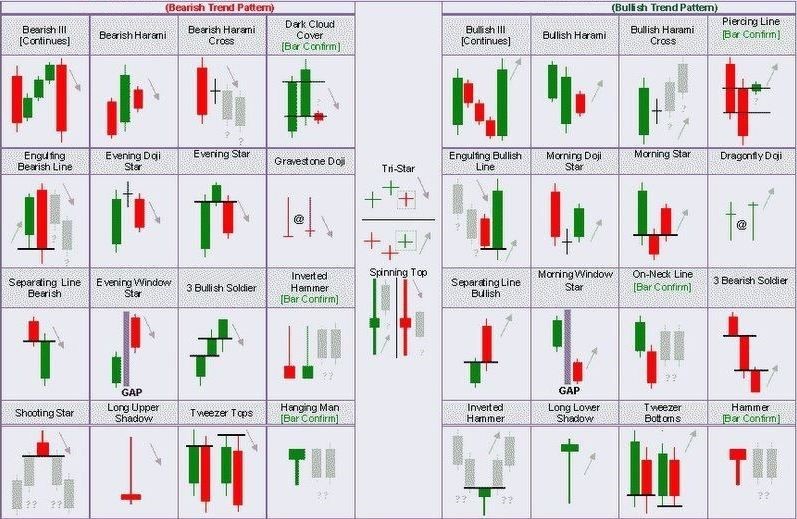
There are a lot of candlestick patterns that can be looked at. Some indicate the end of a movement leg, some indicate the strength of a trend. Understanding this will give you an advantage in knowing where you may want to enter or exit the market. Below are some of the most commonly known candlestick patterns that will help you understand the movement of the market.
BUILD A CASE
So now you have all the tools needed for effectively trading the markets. However, don’t get too overconfident. The markets can be a deceiving and confusing place. That is why the key to being a professional trader is to build a case. What this means is that before entering a position in the market, you should build a case just like a detective.
No one knows whether the market will go up, down, sideways or in circles. What we can do is give our best educated guess and open a position knowing that we have minimized all risks possible. That is why when setting a strategy, you will need to make a checklist. List out all the conditions needed to open up a buy or sell position. If a set up is found and checks everything on your list, then you may enter your position.
It is highly unadvisable to enter the market if even one of your conditions is not met. This is because it increases your risk of losing. It is better to miss out on an opportunity rather than going in blindly and gambling. Keep track of all your trades in a trading journal and this will help you identify any problems you may have with your trading strategy.
KNOW WHEN YOU’RE GOING TO ENTER/EXIT
So, you’ve built a case based on everything you know. What is important is to know when to enter and exit the market. Trading is about timing. If you get the timing wrong and predict something that will happen too far into the future and enter too early, you will most likely end up losing money early on.
That is why you need to, first of all, set an entry point. Then, set up your exit points; meaning, your Take Profit (TP) and Stop Loss (SL). A lot of traders starting out will fail to set up exit points. So perhaps, early on they will see a profitable position that may turn into a losing position in the long term. Why? Because they didn’t set a target and were chancing it.
Entering the market means knowing when you are going to get out. Be decisive with your positions. It’s better to take home some profit rather than suffer extravagant losses. It’s also better to suffer a minor loss rather than chance it for long term profit.
EMOTIONS LEAD TO FAILURE
When your money is on the line, it is understandable that you will feel uncomfortable. The common emotions you will face are fear, anxiety, greed and anger. The reason why in tip number 8 we tell you to build a case, is so that you can get rid of the fear and anxiety and anger. You will know that you did your best, and sometimes the market just doesn’t go your way and that is perfectly fine. In tip number 9, we tell you to know when to enter and exit the market. The reason for this is to control fear and greed.
Fear comes in when you are incurring a loss. Do not move your stop loss. Before you entered the market, you determined where you are going to exit on an objective basis. So, if you move your stop loss now, it is not based on objective reasoning. The same goes for take profit. Do not move your take profit. Traders tend to get greedy and start moving their take profit for larger gains; only to find that the market ends up reversing on them.
Do not let your emotions control you. Once you have set up a plan and put it in motion, trust in your plan. Know that you have done everything that you could have done.